Dashboards
A dashboard puts the charts you care about on one screen. Open Insights, then Dashboards.
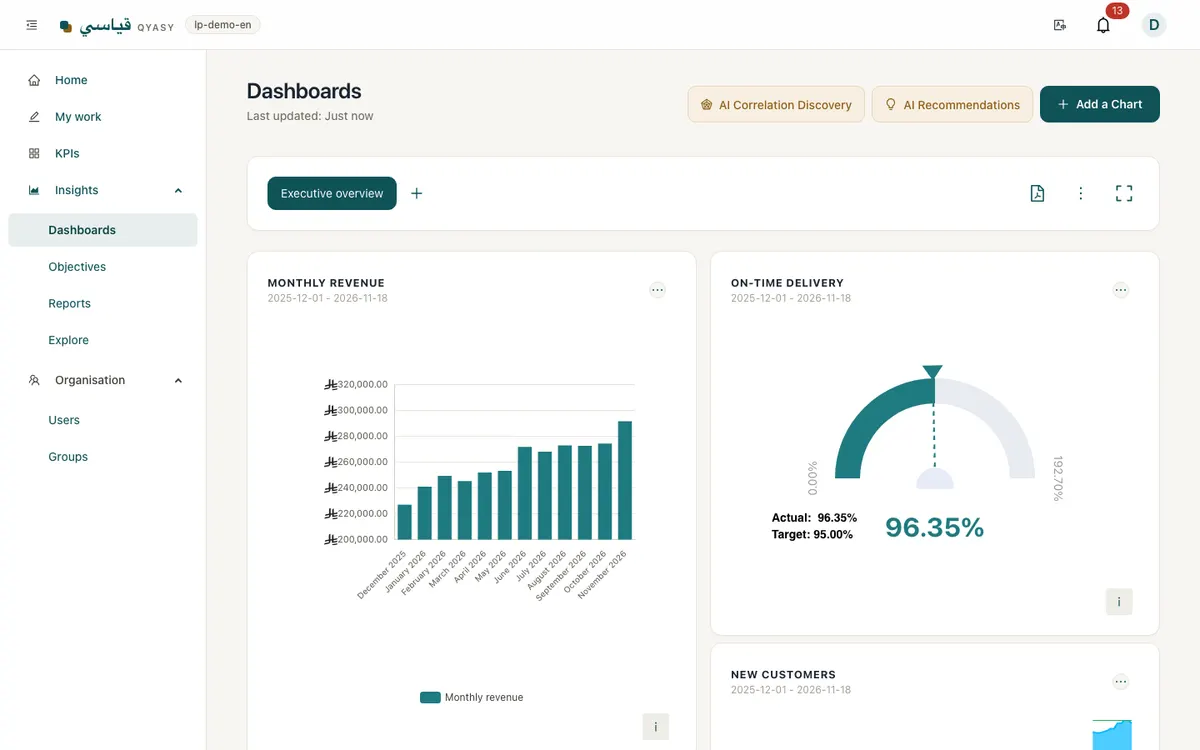
Create a dashboard
- Choose Add a new dashboard.
- Enter a Dashboard name.
- Pick a layout: how many charts sit side by side and how large they are.
- Save, then choose Add a Chart to fill each place.
Add and edit charts
- Choose Add a Chart.
- Pick the KPI and the date range.
- Choose the chart type, such as line, bar, gauge or a single number.
- Save. Use Chart options on a chart to edit, copy it to another dashboard, or delete it.
Share a dashboard
Use Share this dashboard:
- Share with people or groups inside your company. You can restrict the data they see.
- Public Access creates a link that anyone can open without signing in. Turn it off at any time and the link stops working.
- Copy Dashboard copies it to one or more groups.
Office screens (TV mode)
To show dashboards on a TV or wall screen:
- In Share this dashboard, turn on Public Access, then use Copy TV link.
- Open the link in the screen's browser. It needs no sign-in, shows the dashboard full screen and refreshes every 5 minutes.
- To rotate between several dashboards, turn on public access for each one and add
&rotate=followed by the other dashboards' share codes, separated by commas, to the end of the TV link.
Treat public and TV links like keys: anyone who has the link can see that dashboard.
Ready to make performance clear to everyone?
Start free trial